The move to using Docker for the Open edX® devstack brought many improvements to our workflow, but it isn't obvious how to use a key developer tool with the Docker-based devstack: a python debugger.
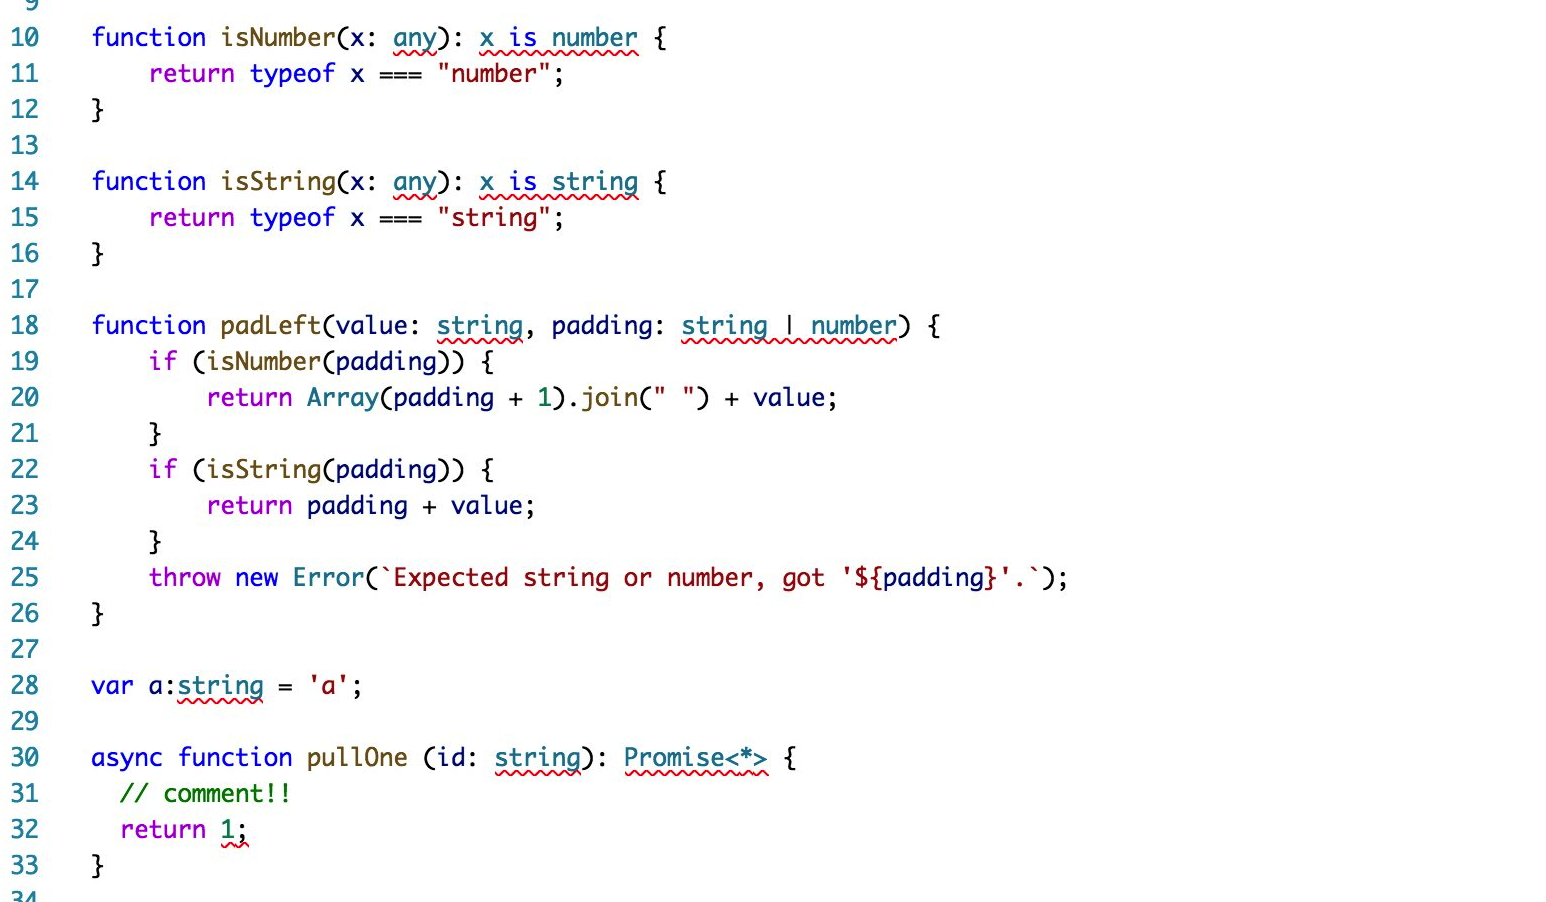
With recent changes to Visual Studio Code, it’s now possible for VS Code users to get Intellisense and debugging working with your containerized devstack LMS. This will give you as-you-type auto-completion of most python code, near-real-time pylint linting using edX®'s linting rules, and the ability to step through edxapp's execution and pause and inspect variables while it runs.
Make sure VS Code is up to date (the beta/insiders build is not required anymore, but you do need the latest release)
The first step is to install the Remote - Containers VS Code extension (or the Remote Development Pack if you also want the SSH remote extension) and start up your Open edX devstack (make dev.up) if it’s not already running.
Then we need to install the debugger package into the edxapp venv:
$ make lms-shell
$ pip install ptvsd
Alternatively, you can add ptvsd to edx-platform/requirements/edx/private.in and run pip-compile private.in, before provisioning your devstack. This will ensure it always gets installed during provisioning.
Now we'll create a specific workspace to save our settings. In your edx-platform repository, create a .vscode folder, which will be ignored by git. Put the following into edx-platform/.vscode/edxapp-remote.code-workspace:
{
        "folders": [
            {
                "path": "/edx/app/edxapp/edx-platform"
            }
        ],
        "settings": {
            "python.pythonPath": "/edx/app/edxapp/venvs/edxapp/bin/python",
            "python.linting.pylintEnabled": true
        }
    }
Next, we must create a Launch Configuration to enable debugging, by putting the following into edx-platform/.vscode/launch.json:
{
    "version": "0.2.0",
    "configurations": [
        {
            "name": "Python: Remote Attach to LMS Container",
            "type": "python",
            "request": "attach",
            "port": 5678,
            "host": "localhost",
            "justMyCode": false,
            "pathMappings": [
                {
                    "localRoot": "/edx/app/edxapp/edx-platform",
                    "remoteRoot": "/edx/app/edxapp/edx-platform"
                }
            ]
        }
    ]
}
Finally, we need to make sure the LMS enables debugging via ptvsd. Add the following to edx-platform/lms/envs/private.py:
import os
    import ptvsd
    if os.environ.get('RUN_MAIN') or os.environ.get('WERKZEUG_RUN_MAIN'):
        ptvsd.enable_attach(address=('0.0.0.0', 5678), redirect_output=True)
Now Press F1 to open the Command Palette, and choose Remote-Containers: Attach to Running Container…
Select the edx.devstack.lms container.
This will open a new Visual Studio Code window, this time running inside the LMS container. Now we will be working on this VSCode window.
Open the workspace created earlier by choosing File > Open Workspace and open /edx/app/edxapp/edx-platform/.vscode/edxapp-remote.code-workspace
We'll also need to install the Python extension inside the container. Click on the Extensions tab of VS Code on the left of the window. Note that most of your extensions are not available yet. Find the Python Extension in the “Local - Installed” panel, and click “Install on Attached Container”
And you are now ready to start developing and debugging. You will now have python Intellisense, linting, and debugging with breakpoints and local variables working! (At least for the LMS; for Studio, repeat as needed).
To attach the debugger to the LMS process that’s always running in the container, just hit Debug > Start Debugging or press F5. Note that if you make any changes to the code, Django will restart and that will disconnect the debugger, so you’ll have to reconnect.
You can visit the official discussion forum for questions or reach out to us if you need any support. Happy debugging!